DriveSafe v2
Multi-Class Classification of Safe and Risky Driving, with incorrectly-selected validation data
DriveSafe v2 was just built on top of v1, but instead of having just 2 categories of safe and risky, we introduced a few more categories to make the model more robust.
The main premise was that the model would be able to predict more than just safe and risky driving, but also be able to predict if the driver was tailgating, weaving lanes, etc.
- These were features that would remain undetectable by conventional car sensors such as accelerometers and gyroscopes, but could be detected through video footage by a camera/dashcam.
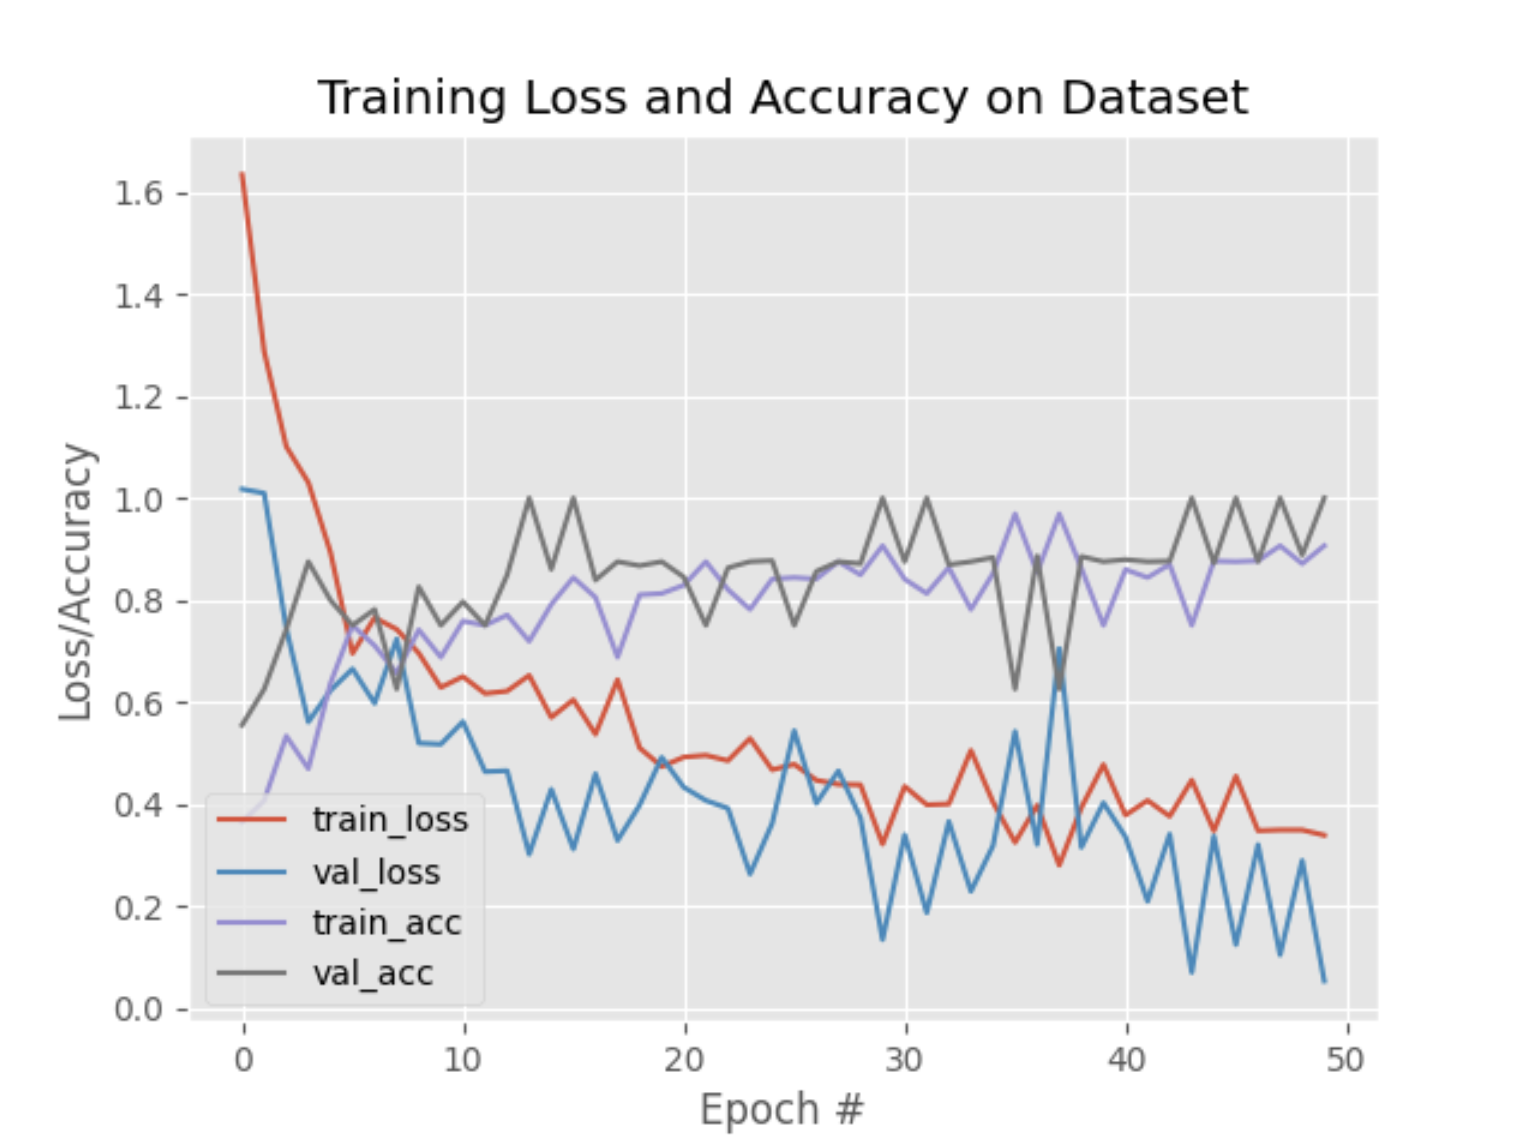
However, as explained in this sub-page (v2 – Validation Error), the training plot of this version of the model has been found to be invalid, stemming from that fact that training loss was higher than the validation loss, was pointed out by our mentors in the Mentor Feedback section.
Read the v2 – Validation Error page to learn more about this discovery, and the subsequent investigation and hypothesis that followed.
Categories
safecollisiontailgatinglane weaving
Demo
The triggered labels are displayed on the center-right of the video, and the cumulative count of each label is displayed in an animated matplotlib graph on the bottom-right.
Improvements
- Unreliable training plot due to incorrect validation data selection.
- Added multiple categories but still missing temporal data in the model.
Training Plot
Hyperparameters
- Batch Size: 32
- Epochs: 50
opt = SGD(learning_rate=1e-4, momentum=0.9, decay=1e-4 / args["epochs"])
model.compile(loss="categorical_crossentropy", optimizer=opt,
	metrics=["accuracy"])

print("[INFO] training head...")
H = model.fit(
	x=trainAug.flow(trainX, trainY, batch_size=32),
	steps_per_epoch=len(trainX) // 32,
	validation_data=valAug.flow(testX, testY),
	validation_steps=len(testX) // 32,
	epochs=args["epochs"])
Resources
| Resource | Platform | Link |
|---|---|---|
| Code | GitHub | Link |
| Model | Kaggle | Link |
| Dataset | Kaggle | Link |
Mentor Feedback
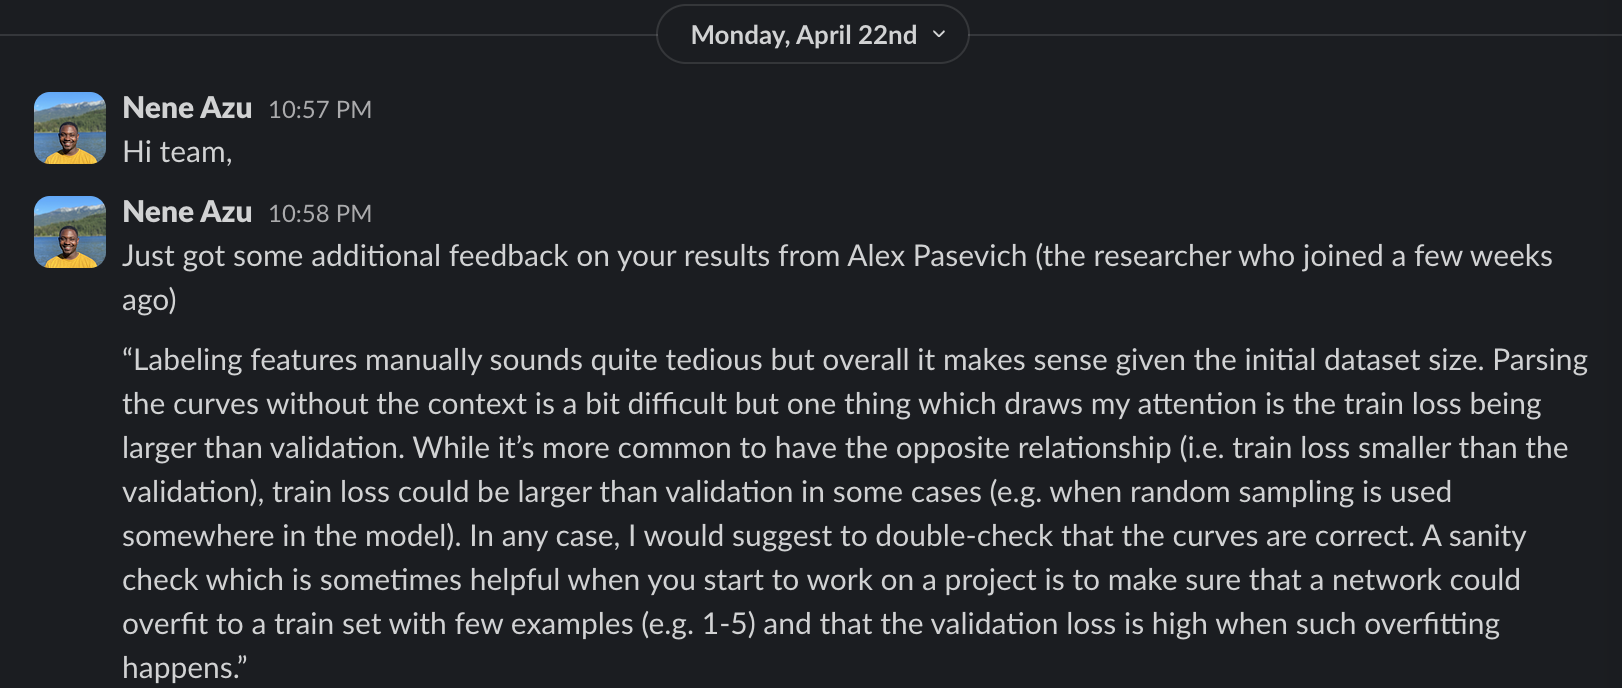
~ Alex Pashevich, ML Researcher at Borealis AI